KashAppsAll apps

Bitcoin and Ether charts

BTC ETH Tracker

Bitcoin and Ether prices, halving cycle charts and a private portfolio. No account.

Coming to Google Play

No store link yet. It goes here on launch day.

  • Information only, not advice
  • Portfolio stays on your phone
  • No account, no ads
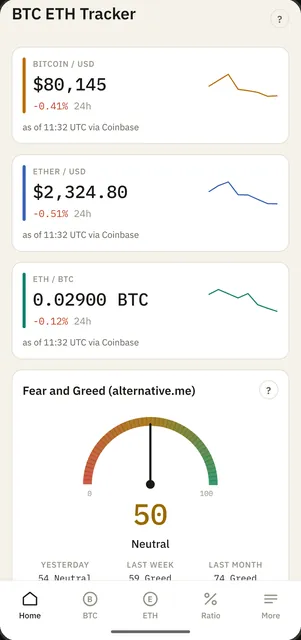
  • Home: Bitcoin, Ether and ETH/BTC prices with a sparkline each, and the Fear and Greed gauge
    Home: live prices with a sparkline each, and the Fear and Greed gauge.
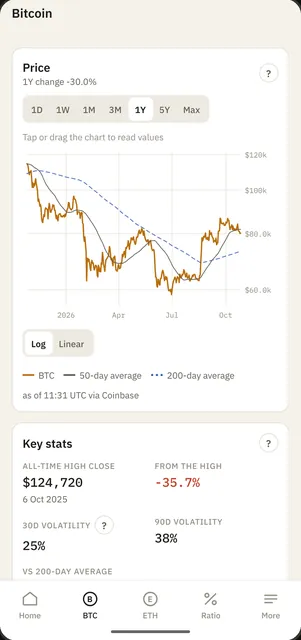
  • Bitcoin price chart over one year with 50-day and 200-day averages and key stats
    The Bitcoin price chart over one year with 50-day and 200-day averages.
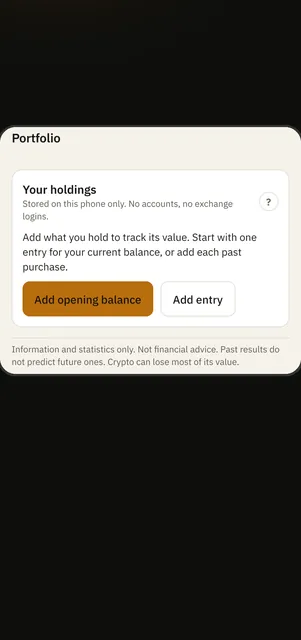
  • Portfolio: an empty holdings card, stored on the phone only, with the not-advice note
    Portfolio: holdings are stored on this phone only.

BTC ETH Tracker shows Bitcoin, Ether and the ETH/BTC ratio in US dollars or pounds, with charts that go back to 2012. It is for reading the numbers. It does not trade, and it does not tell you what to do.

What it does

Prices and charts, with sources

Live BTC and ETH prices in US dollars or pounds, charts from 1 day to the full history back to 2012, and the time and source of every update.

Every number explained

Every chart and number has a "?" button that explains where it comes from and what it cannot tell you.

A portfolio that stays on your phone

Add what you hold, with fees and notes, and see average cost or FIFO and gains and losses worked out from what you entered. Export or restore a backup. Tax is not calculated.

All the features
  • Live prices for BTC and ETH with a 7-day sparkline, the change since the daily reference, and the time and source of the last update.
  • Price charts from 1 day to the full history, as lines or candles, on a log or linear scale, with 50-day and 200-day averages and the halving dates marked.
  • Drawdown from the running high, 30-day and 90-day volatility, all-time high and distance from it.
  • The ETH/BTC ratio with a monthly-return heatmap and calendar-month seasonality.
  • Fear and Greed gauge and history, plus a five-part proxy built from volatility, momentum, positioning, dominance and attention.
  • A halving clock: days since the last halving and the next one, worked out from the live block height, and a halving-cycle overlay for 2012, 2016, 2020 and 2024.
  • Every chart and number has a "?" button that explains where it comes from and what it cannot tell you.
  • Your portfolio stays on your phone: add what you hold in USD or GBP, with fees and notes, and see average cost or FIFO, gains and losses worked out from what you entered. Export to JSON or CSV, or restore from a backup. Tax is not calculated.
  • No account, no login, no ads, no analytics and no tracking. Charts and studies are worked out on the phone from a bundled daily history, so they open offline.

What you will find

Charts
Lines or candles, log or linear, with 50-day and 200-day averages and the halving dates marked.
Cycles
A halving-cycle overlay for 2012, 2016, 2020 and 2024, and a halving clock worked out from the live block height.
Offline
Charts and studies are worked out on the phone from a bundled daily history, so they open offline. Live prices need a connection.

Privacy

The developer collects nothing. The app asks public price services for market data and keeps your portfolio only on your phone.

Read the privacy policy

Questions

Does it tell me what to buy or sell?

No. It gives information and statistics only. It is not financial advice, and it does not trade.

Can I connect an exchange account?

No. There is no account and no exchange login. You type in what you hold.

Where do the prices come from?

Public price services. Each screen lists its data sources, with credit to each provider.

What does it do with my data?

The developer collects nothing. Your portfolio entries and settings stay on your phone.

When is it out?

Not yet. It is coming to Google Play. This page will link to the listing when it is live.